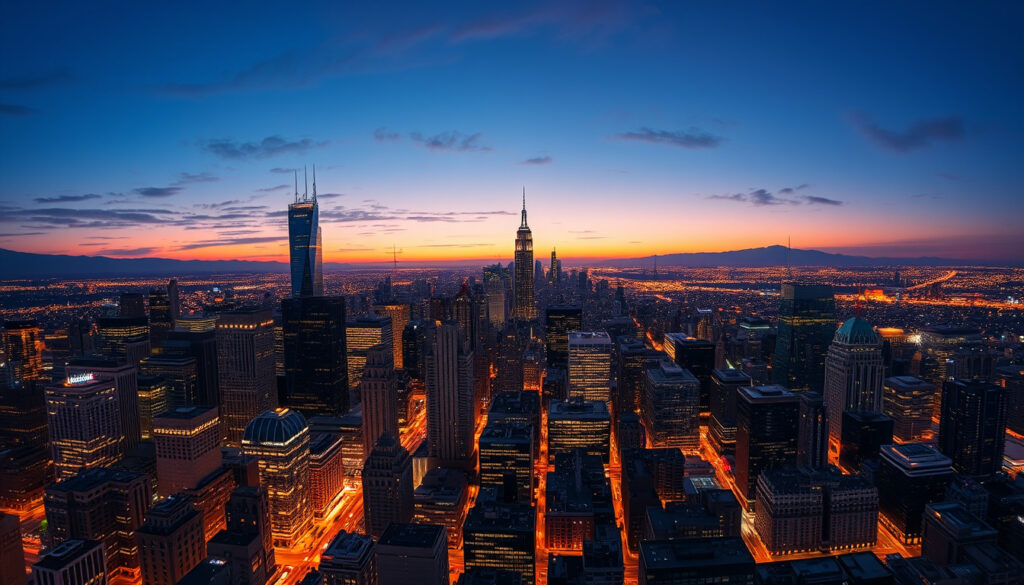
Largest Cities in US by Population and Metro Areas
New York and Los Angeles dominate US population rankings, but the numbers tell different stories depending on whether you measure city limits or metropolitan areas. The New York metropolitan area holds roughly 20 million people, yet the city’s municipal boundary contains just over 8 million — a gap that reshuffles every major ranking and carries real consequences for policy, economics, and infrastructure planning.
New York City population: 8,478,072 (2020 Census) · Los Angeles population: 3,898,747 (2020 Census) · Chicago population: 2,746,388 (2020 Census) · Houston population: 2,304,580 (2020 Census) · Largest metro area: New York (19.4M est.)
Quick snapshot
- New York MSA: 19,940,274 (2024 Census, US Census Bureau)
- US metro population grew 1.1% to 293.9M (US Census Bureau)
- 88% of US metro areas gained population 2023–2024 (US Census Bureau)
- 2026 Census city-proper estimates still pending official release
- Post-2024 growth rates for mid-sized metros not yet published
- Whether Sunbelt deceleration begins in 2025–2026
- New York MSA lost 277,000 residents 2020–2021, has since rebounded (US Census Bureau)
- Vintage 2024 Census estimates published 2025 (US Census Bureau)
- Orlando MSA grew 13% from 2020 to 2024 (US Census Bureau)
- Sunbelt metros likely to keep leading growth through 2025–2026
- Dallas-Fort Worth MSA projected to cross 8.5M
- New York MSA growth rate expected to slow from 2024 pace
| Metric | Value |
|---|---|
| Largest City Proper | New York City (8,478,072) |
| Largest Metro | New York-Newark (19.4M est. 2024) |
| Fastest Growing | The Woodlands, TX (recent Census) |
| By Area #1 | Sitka, AK (2,870 sq mi) |
What are the 10 largest cities in the US in order?
Eight American cities exceed one million residents within their municipal boundaries. When ranked by city proper — the legal jurisdiction of the city itself — the top five have held relatively stable positions in recent Census cycles.
| Rank | City | Population (2026 Est.) | Source |
|---|---|---|---|
| 1 | New York City | 8,346,955 | World Population Review |
| 2 | Los Angeles | 3,869,891 | World Population Review |
| 3 | Chicago | 2,709,364 | World Population Review |
| 4 | Houston | 2,304,580 | World Population Review |
| 5 | Phoenix | 1,640,000+ | World Population Review |
| 6 | Philadelphia | 1,580,000+ | World Population Review |
| 7 | San Antonio | 1,470,000+ | World Population Review |
| 8 | San Diego | 1,380,000+ | World Population Review |
| 9 | Dallas | 1,340,000+ | World Population Review |
| 10 | San Jose | 1,010,000+ | World Population Review |
City proper populations are useful for municipal budgets and electoral representation, but they systematically understate how many people actually live in a region’s economic orbit. Houston’s city limits cover 671 square miles — larger than four New York City boroughs combined — yet the metro area sprawls across 9,328 square miles of the greater Gulf Coast region.
The implication: comparing cities by municipal boundaries alone tells only part of the story, especially for policy discussions around housing, transit, or regional GDP.
What are the 20 largest metropolitan areas in the US?
Metropolitan Statistical Areas cut across county and sometimes state lines, grouping together the economic and social communities centered on a major city. The Census Bureau defines an MSA by its commuting patterns and regional economic integration, producing a far larger footprint than city limits alone.
| Rank | Metro Area | Population (2024 Est.) | Source |
|---|---|---|---|
| 1 | New York-Newark-Jersey City | 19,940,274 | US Census Bureau |
| 2 | Los Angeles-Long Beach-Anaheim | 13,288,904 | GeoPostcodes |
| 3 | Chicago-Naperville-Elgin | 9,879,320 | GeoPostcodes |
| 4 | Dallas-Fort Worth-Arlington | 8,344,032 | Wikipedia |
| 5 | Houston-The Woodlands-Sugar Land | 7,796,182 | Wikipedia |
| 6 | Atlanta-Sandy Springs-Alpharetta | 6,577,299 | GeoPostcodes |
| 7 | Washington-Arlington-Alexandria | 6,538,392 | GeoPostcodes |
| 8 | Philadelphia-Camden-Wilmington | 6,325,972 | GeoPostcodes |
| 9 | Miami-Fort Lauderdale-Pompano Beach | 6,423,080 | GeoPostcodes |
| 10 | Phoenix-Mesa-Chandler | 5,469,313 | GeoPostcodes |
The top 10 US metro areas combined house roughly 85 million people — more than a quarter of the entire US population. Their growth or contraction affects national economic output, federal representation, and infrastructure investment in ways city-level data simply cannot capture.
What this means: Metro areas now house 86% of the US population as of July 1, 2024, according to the Census Bureau’s metro area trends analysis. For anyone studying regional economies, labor markets, or real estate, MSA-level data is the more operationally relevant measurement.
What are the 30 largest cities in the United States?
Beyond the top 10, the next tier of large American cities includes several that serve as regional anchors for distinct parts of the country. San Antonio represents the Texas Hill Country and South Texas. San Diego anchors the Baja California border economy. San Jose sits at the heart of Silicon Valley’s technology cluster.
Philadelphia, the sixth-largest city proper, is notable for being the most populous city in the Northeast outside of New York City proper. It functions as a major center for education, healthcare, and historical tourism, with a municipal population that has remained relatively stable in recent estimates.
These mid-tier cities — ranked 11 through 30 — typically fall in the 500,000 to 1.4 million range. Cities like Austin, Jacksonville, Columbus, and Indianapolis serve as state capitals and major regional economic engines, often with growth rates that outpace their larger coastal peers.
Larger city proper populations often correlate with higher municipal debt burdens, aging infrastructure, and slower growth rates. Austin, Texas, with roughly 970,000 residents, grew at 2.1% annually from 2020 to 2023, while several larger cities in the Northeast and Midwest have flat or declining populations.
The pattern: Sunbelt cities below the top 10 are often growing faster than older industrial cities that rank above them, suggesting the next decade could reshuffle the bottom half of the top 30 list.
What is the largest city in US by area?
Rankings by land area produce a strikingly different picture than population-based lists. The largest American cities by square mileage are almost all Alaska municipalities, which cover vast territories that include significant wilderness and water bodies within their legal boundaries.
- Sitka, Alaska — 2,870.3 square miles, population approximately 8,300
- Juneau, Alaska — 2,816.4 square miles, population approximately 32,000
- Wrangell, Alaska — 2,566.4 square miles, population approximately 2,100
- Jacksonville, Florida — 747.4 square miles, population approximately 950,000
Jacksonville stands out as the largest city by area in the contiguous United States, combining its substantial municipal footprint with a population that places it in the top 30 by population as well. For Sunbelt migration analysis, Jacksonville represents a case where geographic sprawl and population growth are happening simultaneously.
The gap between Sitka’s 2,870 square miles and New York City’s 303 square miles illustrates how municipal boundary definitions create apples-to-oranges comparisons. Sitka encompasses mountainous terrain, islands, and water that would never be included in a typical city’s legal jurisdiction in the lower 48 states.
What is America’s fastest growing city?
Growth rate data from the Census Bureau and independent analyses reveals a clear pattern: Sunbelt metropolitan areas in Texas, Florida, and Arizona are outpacing older Northeastern and Midwestern cities by significant margins.
Orlando-Kissimmee-Sanford MSA grew 13% from 2020 to 2024, adding 267,126 residents, according to GeoPostcodes’ metro area analysis. Sunbelt metros like Austin showed 2.1% annual growth rates during the same period. Meanwhile, cities like Chicago and Detroit have experienced population declines as residents relocate to lower-cost, warmer-climate alternatives.
The New York MSA lost 277,000 residents during 2020 and 2021 — during the pandemic — but rebounded strongly, adding 213,403 residents from July 2023 to July 2023, according to Census Bureau press release data. That recovery demonstrates how even large population centers can experience dramatic swings based on economic conditions, housing costs, and remote work flexibility.
The US Census Bureau reports that 88% of US metro areas gained population between 2023 and 2024, with growth concentrated in the Sunbelt while select Rust Belt cities continue to lose residents. For policymakers, the fiscal implications are clear: growing metros need expanded infrastructure and housing supply, while shrinking cities face declining tax bases and aging public services.
The pattern: Fastest-growing metros are not simply large cities — The Woodlands, Texas, a master-planned community within the Houston MSA, ranks among the fastest-growing places in America. Growth happens at the neighborhood and county level within metros, not uniformly across entire regions.
City proper vs. metro area: What the numbers tell us
Understanding the distinction between city proper population and Metropolitan Statistical Area population is essential for interpreting any ranking of US cities. City proper data covers the legal municipality — the entity that files budgets, conducts elections, and delivers services. MSA data covers the commuting shed: the region where residents routinely travel into the core city for work.
The Census Bureau’s Vintage 2024 estimates, released in 2025, provide both city-level and metro-level data, enabling direct comparison. For example, New York City’s municipal boundary held 8,346,955 residents in 2026 projections, while the New York-Newark-Jersey City MSA encompassed 19,940,274 residents as of July 1, 2024.
Confirmed facts
- 2020 Census city populations: New York City 8,478,072; Los Angeles 3,898,747; Chicago 2,746,388
- 2024 MSA estimates from Census Bureau showing top 10 metro rankings
- US metro population grew 1.1% from 2023 to 2024, reaching 293.9 million
- New York MSA added 213,403 residents in the 2023–2024 period
What’s unclear
- 2026 Census city proper estimates not yet officially released by the Census Bureau
- Full 2025 metro area estimates pending publication
- Post-2024 growth rate deceleration for Sunbelt metros not confirmed
“Growth in Metro Areas Outpaced Nation — Between 2023 and 2024, the number of people living in a U.S. metro area increased by nearly 3.2 million (or around 1.1%) to 293.9 million.”
— US Census Bureau official population estimates release
“New Census Bureau population estimates show 88% of U.S. metro areas gained population between 2023 and 2024.”
— US Census Bureau official metro area trends story
worldometers.info, census.gov, proximityone.com, en.wikipedia.org, en.wikipedia.org
US powerhouses like New York and Los Angeles compete prominently within the world’s top cities by population as outlined in 2024 global data.
Frequently asked questions
Is New York the largest city in the US?
Yes, New York City is the largest city in the US by city proper population, with approximately 8.3 million residents in 2026 estimates. However, if measuring by metropolitan area, Los Angeles closes the gap considerably, and several Sunbelt metros are growing faster in percentage terms.
What defines a Metropolitan Statistical Area?
An MSA groups counties together based on commuting patterns and economic integration with a core city. MSAs can cross state lines — the New York MSA includes parts of New Jersey and Pennsylvania. The Census Bureau defines MSA boundaries using Census Bureau data on where people commute to work.
How do US cities rank by land area?
By land area, Sitka, Alaska is the largest city at 2,870 square miles, followed by Juneau and Wrangell, also in Alaska. Jacksonville, Florida is the largest city by area in the contiguous US at 747 square miles. This ranking bears almost no relationship to population rankings.
What is the population of Chicago?
Chicago’s city proper population was estimated at 2,709,364 for 2026, according to World Population Review projections based on Census data. The Chicago-Naperville-Elgin MSA is the third-largest metro area at approximately 9.9 million residents.
Which state has the least populated cities?
Wyoming, Vermont, and Maine have the smallest city proper populations among their largest municipalities. Cheyenne, Wyoming’s capital, has roughly 65,000 residents. Vermont’s largest city, Burlington, has approximately 43,000 residents. These figures contrast sharply with the millions in New York, Los Angeles, or Chicago.
Are projections for 2026 reliable?
The Census Bureau releases official estimates for July 1 of each year. World Population Review projections extending to 2026 are extrapolated from these official estimates and carry lower verification certainty than published Census data. For planning purposes, the 2024 estimates remain the most current official figures.
How does Houston compare to Phoenix?
Houston’s MSA had approximately 7.8 million residents versus Phoenix-Mesa-Chandler’s 5.5 million as of 2024 estimates. Both are Sunbelt metros with high growth rates, though Houston’s larger population gives it broader economic diversity. Phoenix has been closing the gap faster in percentage terms due to its smaller baseline.
Related reading
- Things to Do in Orlando
- Time in Las Vegas
- US Census Bureau official metro estimates (2024)
- Census Bureau metro area trends analysis
More related posts
 Partidos del Mundial de Clubes 2025 – Groups, Fixtures & Bracket
 What Is Cephalexin Used For? Uses, Dosage & Side Effects
 Jennifer Aniston Movies and TV Shows – Complete Filmography Guide
 What Is a Content Delivery Network? Definition, Benefits & Usage
 Arlington Gas Leaf Blower Ban 2026: Rules, Timeline, and Guidance
 What Is OneDrive – Cloud Storage Features, Plans and Security
 Google Reviews By Me: See, Find, and Manage Your Reviews
